Findings From 10x’s Recent Round of Submissions

Earlier this summer, we asked people across the federal government to submit their ideas to 10x — a technology investment program housed in the Technology Transformation Services (TTS) office at the U.S. General Services Administration (GSA) that funds new ideas to help the federal government deliver better products and services. The deadline for those submissions closed on July 30, 2019.
In this recent round, we selected 32 projects to start at the Phase 1: Investigation level for FY19 Round 2 funding. In an effort to increase transparency, we’ve conducted a metrics analysis of the submissions process and wanted to share our findings with you.
Evaluation Process: We assigned each submission an ID number and evaluated them impartially based on this ID number. Our evaluation panel consisted of five federal employees that specialize in IT program management, IT policy, engineering, and user-centered design. Each idea was scored in three areas: clarity, alignment, and impact.
Number of Submitters vs. Submissions: We received 237 submissions from 129 individuals, meaning many people submitted multiple ideas. Of the 32 selected ideas, 28 (or 87.5 percent) were from distinct individuals. This shows that 10x chose projects from a variety of submitters, rather than selecting multiple ideas from just a few submitters.
Agency Diversity of Submissions: This year, we received our highest ever number of submissions from outside GSA. Of the total submission pool, 70 percent of submitted ideas were from GSA and partner agencies, and 30 percent were from other agencies. 81 percent of selected ideas were from GSA and partner agencies, and 19 percent were from other agencies. The graphs below illustrate the breakdown. We want to encourage individuals from a variety of agencies to submit ideas! If you are an employee from an agency outside GSA interested in submitting an idea to 10x but you have questions or hesitations about the process, please reach out to 10x@gsa.gov.

Figure 1: FY 19 Round 2 - Submissions
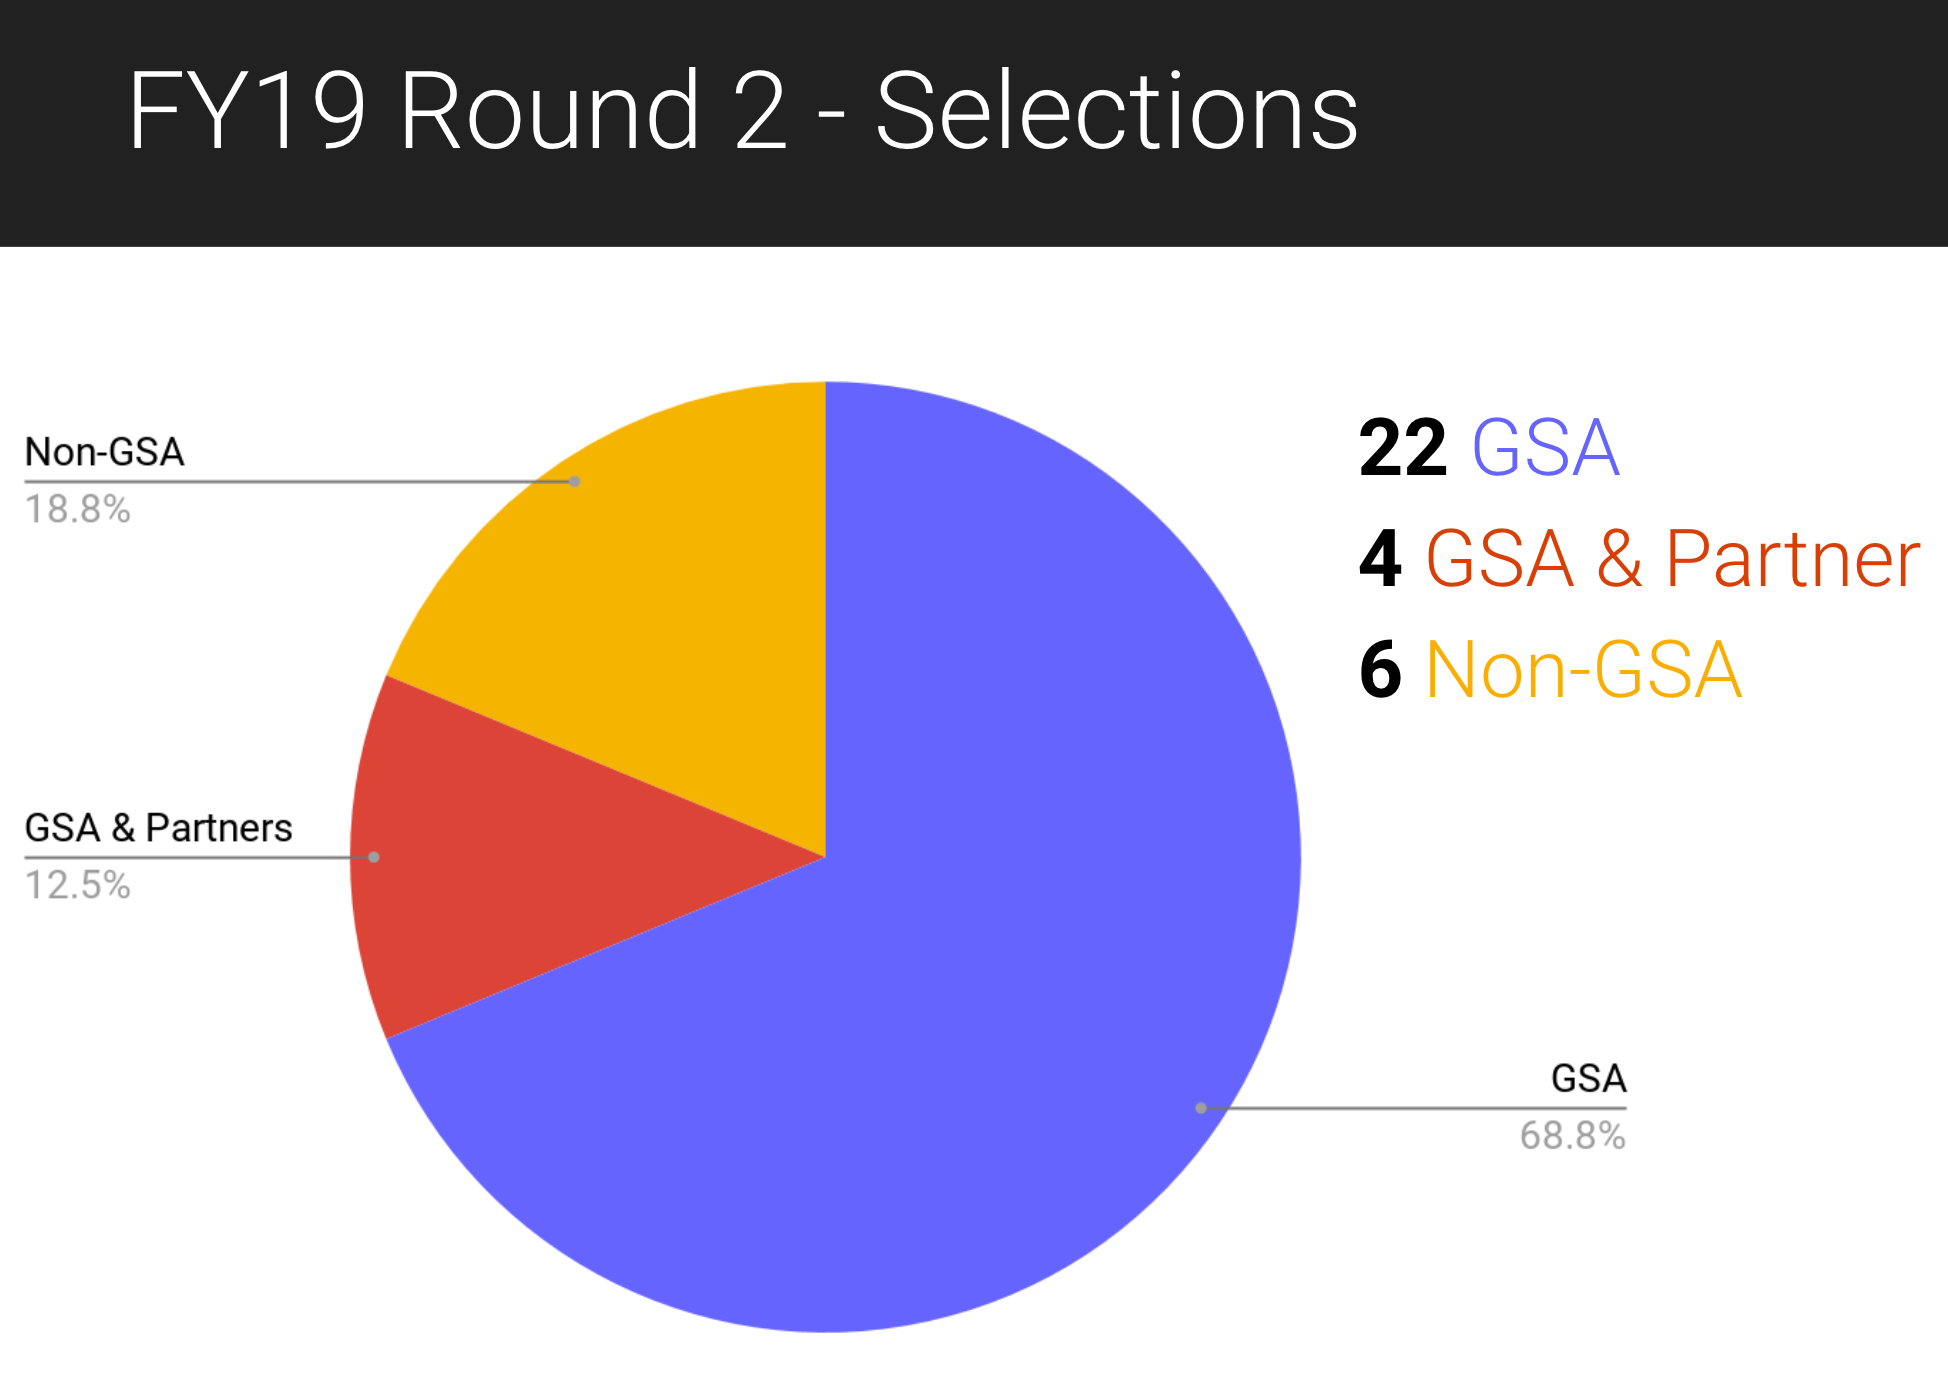
Figure 2: FY 19 Round 2 - Selections
Solution Areas: We categorized and grouped pitches into 8 topic areas and mapped how submitted and selected ideas fell into these categories.

Figure 3: Categories of the Round 2 pitches
10x Projects Pipeline: We also wanted to give visibility into the current Phase 3 and Phase 4 projects in our 10x pipeline and showcase the great work these projects teams are accomplishing.
We have a total of 43 projects awaiting to start and 12 that are ongoing. Here is a breakdown of each phase, illustrated in the below graph.
- Phase 1: 3 ongoing, 33 awaiting start
- Phase 2: 6 ongoing, 9 awaiting start
- Phase 3: 2 ongoing, 0 awaiting start
- Phase 4: 1 ongoing, 1 awaiting start

The 10x Pipeline
And to better highlight the work of our projects, we recently published a new “Projects” page to the 10x website, which details Phases 3 and 4 projects that are currently ongoing and graduated. We’ll continue to update this page as the 10x program and pipeline grow and evolve.
We accept pitches for new ideas on a rolling basis. Learn how to submit an idea. Deadlines for our next round of funding will be posted in Q2 of FY20. 🎉
If you have any additional questions, you can reach out to us at 10x@gsa.gov