4 Tips for Analyzing Mobile Traffic with DAP
It’s not a secret that mobile Internet viewership is booming, but according to a ComScore report released last June, 49% of the audiences for the top 100 digital properties are now mobile-only. Additionally, during the third quarter last year, Gartner reported PC shipments fell 7.7% while IDC Research reported a 10.8% decline. The switch to mobile will continue, and for government websites, the trend is no different.

For this reason, it’s important to optimize your mobile experience. You can use data from the Digital Analytics Program (DAP) to gain insight on your mobile traffic. Do you know the mobile characteristics of your users? Here are four useful tips and reports to analyze your users’ mobile experience:
1. Apply a mobile segment
Whether you’re looking at an Acquisition or a Behavior analytics report, you can see where your mobile users are coming from and how they’re engaging with your website.
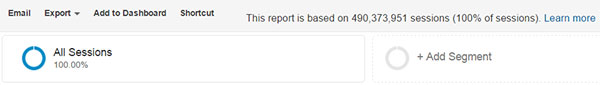
To segment the data specifically for mobile users, click on “+ Add Segment.”
In the search bar, type in “mobile.”
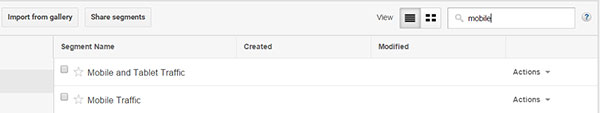
Select the segment that you want to add and click on the blue Apply button of that window pane. After applying, you can navigate all of the standard reports focusing specifically on mobile users.
2. Mobile Audience Overview report
This standard report segments the audience by device category: desktop, mobile, and tablet. It shows you how the share of mobile users are changing with the number of sessions, the percent of new sessions and new users. You can access this report from the left navigation by clicking “Audience” then “Mobile” then “Overview.” You can compare data to a previous date range to see how your mobile metrics are changing.
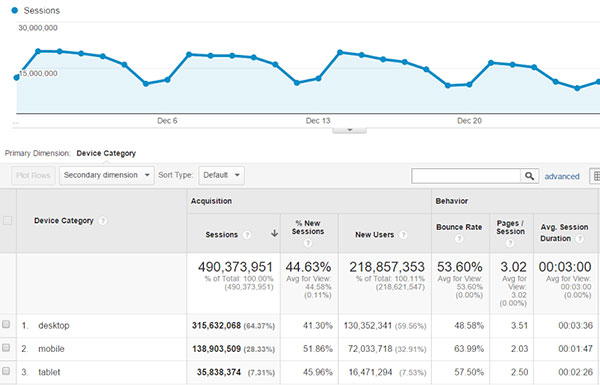
What’s the bounce rate for your mobile users? If it’s high, look into possible causes for that. Is it a good mobile moment? Is your website mobile-friendly? The Pages/Session and the Avg. Session Duration metrics indicate how engaged your mobile users are.
3. Mobile Performance Analysis report
In the DAP Reporting Solutions Catalog, there’s the Mobile Performance Analysis report. It’s a custom report that provides a lot of great insight in one report, using three tabs:
- Mobile Device Performance
- Search Performance
- Page Performance
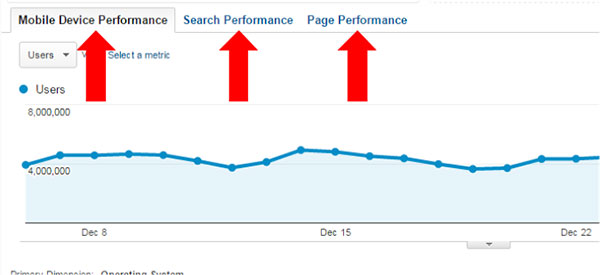
Each tab has three levels of dimension drill downs. For example, in the Mobile Device Performance tab you can click on the Operating System to see Mobile Device Info. From there, you can click on Mobile Device Info to see Landing Page data.
The Search Performance tab contains data on keyword performance in relation to user engagement. The Page Performance tab covers the effectiveness of landing pages, traffic sources and whether users are new or returning.
4. Mobile Trends Dashboard
This dashboard provides you with an overview of your agency’s mobile sessions. You’ll have an overview of:
- Mobile Engagement
- Device
- Top Pages
- Network Providers
- Top Referring Keywords
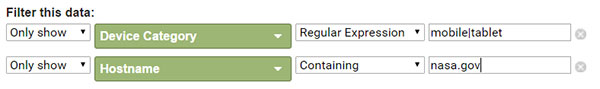
You can add a filter for your website or page to each widget. Click on the writing utensil icon in the top right corner of the widget that you want to edit.
Click on “Add a filter” and then “Add a dimension.”

The dimension can be a hostname, a page or a subdirectory.
Remember, many times it’s helpful to compare data with previous date ranges so you can see trends.
We hope these simple tools will help you get a better understanding of your mobile visitors. Follow DigitalGov’s mobile channel and join the MobileGov Community of Practice for the latest insight on mobile!
If you use any reports or have tips for analyzing mobile traffic, please let us know in the comments!