Results: 2014 Federal User Experience Survey
The cream of the crop of the top of the mountain of ALL of the surveys I run has to be the Federal User Experience (UX) Survey. It’s the second time I’ve had the privilege of running it with Jean Fox, research psychologist extraordinaire from the Bureau of Labor Statistics. When I start thinking about learning what all of my UX colleagues are doing, and designing solutions for them based on real data, I start clasping my fingers together like Mr. Burns.
The purpose of the survey is simple: to learn about how we can best improve the effectiveness, ease-of-use, and value of federal digital systems by connecting their teams to their customers. For the 2014 survey, we heard from 101 respondents from 35 agencies, so it’s not a scientific survey, but still very telling.
Here are a few things we found out:
1. More agencies are focusing on UX
In our 2013 survey (PowerPoint presentation, 282 KB, 22 slides) our respondents said that, on average, they have two full-time and two part-time people focused on User Experience. This year, we asked if the User Experience resources at their agency was growing, shrinking, or stayed the same.

The results were very encouraging: 51% said their resources remained the same, 38% said they increased, and only 11% said they were decreasing. This trend is in line with larger trends about increasing popularity in User Experience design, research and adoption. We learned that (at least) nine federal agencies have Usability Labs, and many others are contemplating building ones as we speak. We’re seeing the use of eyetrackers, heatmaps, mobile device testing and lots more. Huzzah!
For the past two years, we asked people how widespread User Experience is at their agency. This question is based on the many types of User Experience maturity models out there.

The ideal space to be is in the top—where there is end-to-end focus on the customer, and support comes from the top. Last year, there seemed to be few agencies who fit into these upper categories, but this year we saw huge gains. That’s testament to the hard work and careful documenting of the benefit of User Centered Design by so many of you. Kudos!
2. User Experience-ers come in all shapes, and sizes
Sometimes, User Experience has its own department, and the practitioners are clearly “labeled” with titles that have User Experience, Usability or the like in them. Other times, not so much. In the federal space, User Experience has many “homes.”

Traditionally, customer research was handed by the marketing department. Then as digital systems took on a life of their own, the Chief Information Office often held the reins. Or it could be the Program Office, the Administrator, or many others. There are lots of models, both centralized and decentralized, and there’s not one right way.
We also asked people who did UX work to give their job titles. The spectrum was incredible. Only 15% of respondents had User Experience in their title. Many were Web Managers, Project Managers, Public Relations or even Policy Analysts. And the majority of practitioners do customer research only as a part of their jobs, often in limited, ad-hoch fashion.
What this means for us is that connecting people who care about UX is a challenge, and will need to be addressed from multiple angles.
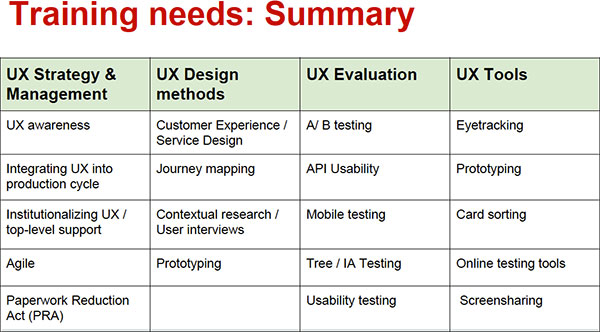
3. Training needs are huge
Government services used to be in person, phone-based and on paper. Then came the Internet. And then mobile. And then apps. And next—who knows? Every technological revolution produces its own products, and techniques and tools rapidly evolve to help evaluate them. We asked people what techniques they were using, and what they wanted to learn more about. Results: People wanted more of just about everything. They wanted to know how to do A/B testing, how to do user interviews, how to get more out of their Web analytics and much more. Here’s a summary.
You can count on seeing some DigitalGov University training on these subjects very soon. If you want to help teach a class, please let us know.
4. Download the full survey summary
There’s lots more, of course. Here’s the entire 2014 Federal UX Survey Summary Results (PowerPoint presentation, 469 KB, 21 slides).
In terms of methodology, the survey was:
- Anonymous
- Open to federal employees and contractors with a .gov / .mil email address
- Non-scientific due to small sample size, but still uncovered valuable information and real trends
- Conducted August-September 2014
If you have a .gov or .mil email address and you’d like to sign up for our Federal User Experience Listserv and be part of our next survey, please email us. Now let’s roll up our sleeves and start to act on all of this!